In 1906, William Sumner defined ethnocentrism as the “view of things in which one’s own group is the center of everything, and all others are scaled and rated with reference to it”. Among the ethnocentric, Sumner continued, “each group nourishes its own pride and vanity, boasts itself superior, exists in its own divinities, and looks with contempt on outsiders” [13]. This notion of “in-group favoritism” continues to inspire research and new questions on a wide range of social groups. In an attempt to bring some of these questions back in time, the analysis below uses social network data to evaluate in-group and out-of-group dynamics in a network of historical writers.
The Spenserians Database
To build a social network of early modern writers, one needs some data. The data used below comes from the Spenserians database, David H. Radcliffe’s phenomenally rich database with over 25,000 hand-keyed original poems and structured metadata on virtually all writers in the Spenserian tradition of poetry. The database builds on 200 years of bibliographical research on the Spenserian tradition, and can therefore justly claim “its selection criteria are formal (anyone who wrote in Spenserian stanzas … is included) and its scope comprehensive for printed materials in English”. From its humble origins in the 1990’s as a digital HyperCard project to its current implementation on a robust LAMP architecture, the Spenserians Database has evolved into the definitive digital collection of Spenserian poetry.
The Spenserians database includes rich, curated metadata for roughly 1,200 writers in the Spenserian tradition. The database records the career, writing genres, education level, religion, nationality, and gender of each of those poets using a reserved vocabulary of terms. This structural metadata is extremely rare, and serves as the foundation for the network analysis below.
Here is a breakdown of the writers in the database by each of those metadata fields:
Poet Metadata Overview
A good majority of the archive is clearly comprised of English clergymen of an Anglican faith. That said, there are enough observation counts in other metadata values to allow for some interesting insights below.
It’s helpful to remember the metadata value counts above are not static but change over time. The following chart shows how the values within each metadata category change over time. By hovering over the chart, you can see the percent of writers in each decade that have a given metadata value:
Poet Metadata Over Time
Occupation-wise, one finds here that while early poets were often secretaries and courtiers, later poets rarely pursued these professions. Writing-wise, the chart reflects a strong rise of editor-poets, a growth that mirrors the increasingly pervasive presence of the printing press over the seventeenth and eighteenth centuries. Religion-wise, the clear trend is away from Anglicanism and toward a larger polyphony of religious devotions. Nationality-wise, English poets are strongly represented in early decades, while American, Irish, and Scottish poets grow better represented over the eighteenth century. Gender-wise, females only become represented in the seventeenth century, and unfortunately never achieve a significant portion of the poet population within the database.
The charts above capture metadata counts within the Spenserians database, but they don’t capture relationships between metadata values in the database. To show the relationships between poet occupations and education levels, for example, the plot below uses a matrix-like view. In the initial chart, each column represents an occupation and each row represents an education level. Changing the first two dropdowns below updates the metadata fields used for column and row values. The color of each cell is controlled by the third dropdown—normalizizing by row makes each row’s values sum to 1, while normalizing by column makes each column’s values sum to 1. By toggling between these values, one can normalize the cell values by either column or row-level metadata values:
Poet Metadata Correlations
These charts offer unique insights into early modern societies. Examining them, one finds for example that writers with no formal education often worked as laborers or within the book trade, while those with private school training were often women schoolmasters. Additionally, Jewish authors tended to achieve higher education levels, while Presbyterians tended to achieve lower education levels. By toggling through the select options above, one can begin to understand the relationship between the various metadata categories within the Spenserians dataset.
Spenserian Networks
If the charts above reveal some of the relationships between Spenserian author metadata fields, they don’t display relationships between Spenserian authors. Fortunately, the Spenserian editors have done so by painstakingly curating the relationships between Spenserian poets. For each author in the database, the database’s editorial team has hand-identified the relationships that writer had with others in the database.
The following chart visualizes these relationships. By hovering on individual writers within the network, you can visualize that poet’s relationships with other poets (click the image to enter):
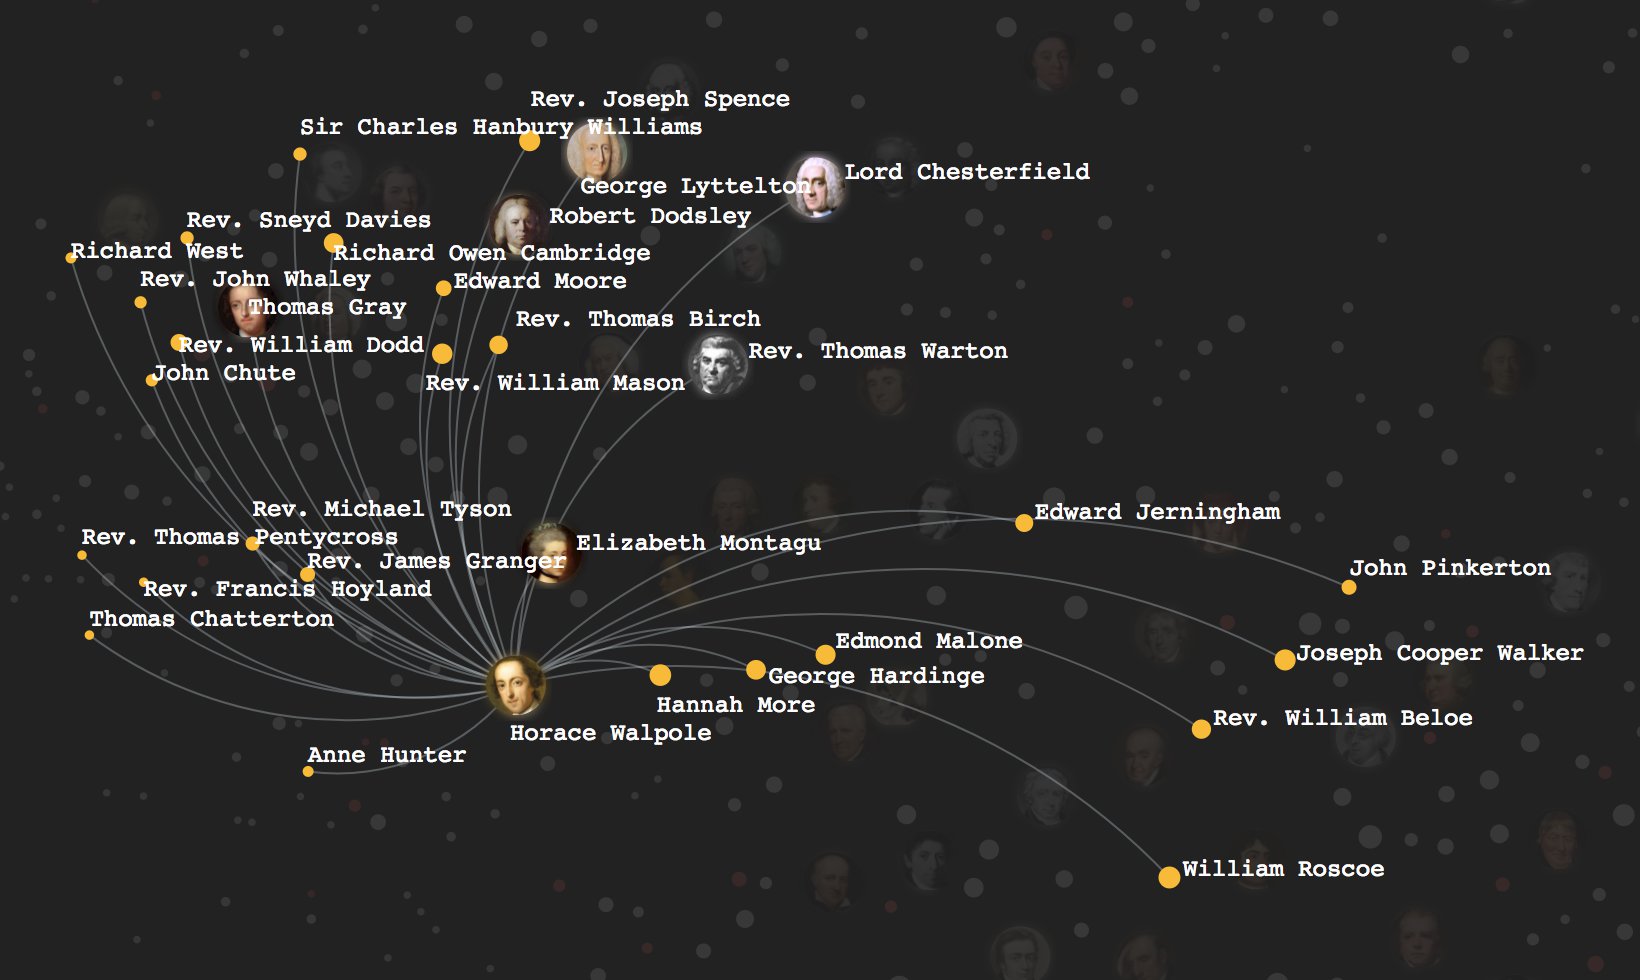
Those familiar with literary history might recognize that the y-axis of the network above indicates the passage of time—from Spenser at the top through the Metaphysical poets, on through the Neoclassical poets, and finally to the Romantics at the bottom. Each poet’s position along the y axis is set by the publication year of their first work within the Spenserian database.
Given this fact, it becomes interesting to consider the historical range of a poet’s associates. There are perhaps three groups of writers here: poets like Horace Walpole (top below) who were associated almost exclusively with earlier writers, those like William Godwin (middle below) who were associated almost exclusively with later writers, and those like Anna Seward (bottom below) who were squarely of their times and had roughly equal shares of earlier and later associates:
One wonders whether authors with predominantly earlier associates have stylstic traints that separate them from those with predominantly later associates. Hopefully subsequent work will be able to pursue this question at some length.
Group Dynamics
The plots above examine the metadata or network connections of Spenserian authors to uncover early modern social trends in the aggregate. By combining author-level metadata with author network connections, the analysis below works to uncover “unexpected relationships” among identified metadata groups.
To do so, we first find the total number of associates that exist for each combination of metadata values. For example, we count the number of times Anglicans are associates of Catholics, the number of times physicians are associates of Scottish writers, and so on. This gives us the raw cooccurrence counts for each combination of two metadata values; e.g. tells us how many Catholics are associations of Anglicans. Then we find the relative proportions of associations each metadata value (e.g. Anglicans) has within each metadata type (e.g. occupations, gender). This tells us that within the gender metadata type, for example, 95% of Anglican relationships are with men, and 5% with women. Finally, to normalize for the varying population sizes among metadata values—e.g. to normalize for the size differential between male and female populations—we subtract from these 95% and 5% values the relative frequency of the given metadata value within the population. 95% of Anglican relationships were with men and 5% with women, for example, but males only account for 93% of the total data population and women account for 7% of the total population. We would therefore say that Anglican relationships with males are more present than one would expect by a margin of 2%, while Anglican relationships with females are less present than one would expect by a margin of -2%. Using this logic, the following chart visualizes over and under-represented relationships:
Unexpected Relationships
It’s important to note that the total data population contains roughly 850 poets, so it’s more than possible that sampling error accounts for some of these deltas. In other words, the small deltas that cluster near the x=0 vertical line above may be the result of a smallish data set, rather than the result of fundamental differences in the underlying population distributions.
The chart below offers a visual explanation of this notion. The dashed bars each represent the relative frequency of one education value within the total corpus—i.e. 40% of all writers in the data set have a B.A. degree, 30% have an M.A. degree, and so on. Each random sample drawn during the simulation has a corresponding 40% probability of being sent to the B.A. group, a 30% probability of being sent to the M.A. group, and so on. Click the Start button to see how this “weighted random sample” simulation plays out:
Weighted Random Sampling
If you start this simulation and watch the number of samples grow, you should see the observations within each metadata value grow closer to the expected number of observations for the given metadata value. After sampling all observations, however, you’ll find each education level has a little more or less than the expected value. This delta is formally known as “sampling error”, or a divergence between the true population statistics and the population statistics observed in a sample from the population. In short, the smaller the sample size, the greater the probability that sample is unrepresentative of the underlying population.
The analysis of network trends is based on the best available curated dataset of early modern networks. That said, the sample is relatively small, and is bound to suffer from sampling error. The only real way around this problem is to increase the sample size by leveraging a larger dataset. I’m currently pursuing this line of analysis, and hope to post some updates soon.