I recently had the good fortune of attending a conference on computational approaches to early modern literature hosted at the University of Newcastle. During the conference, I not only got to meet some outstanding scholars—including Doug Bruster, John Burrows, Hugh Craig, Mac Jackson, and Glenn Roe, to name only a few—but I also had a chance to present some of my recent work on algorithmic approaches to the study of literary influence. In case it might be of interest to others working in related fields, I thought I would share one of the approaches I discussed in what follows below.
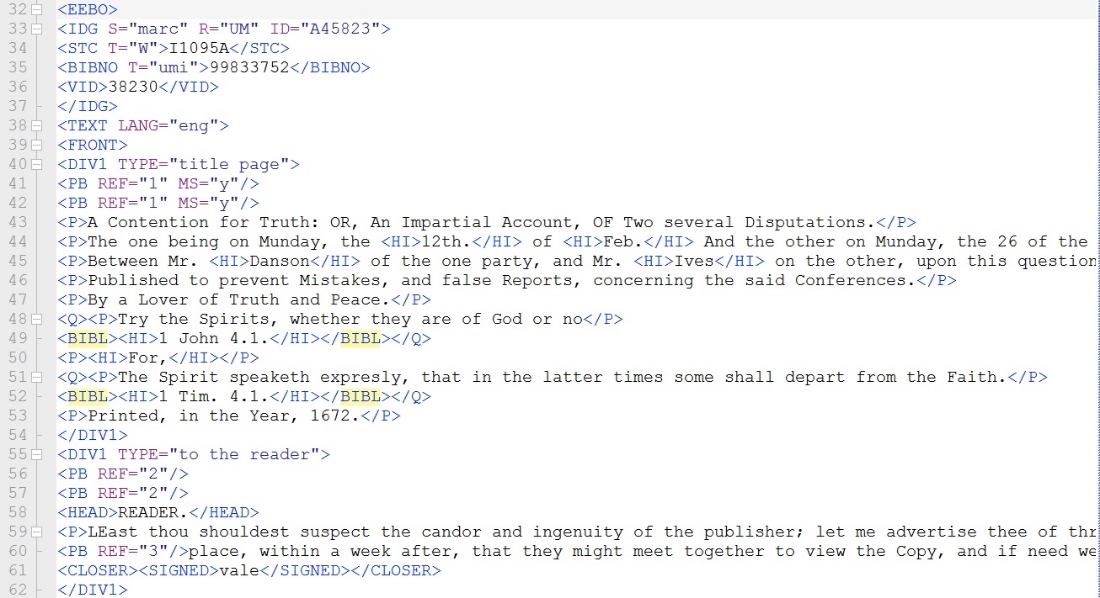
Buried within the EEBO-TCP corpus, I learned some months ago, is a veritable trove of metadata. These [metadata features] indicate when authors include things like stage directions, tables of data, and alchemical symbols in their writing, all of which is great news for the computationally inclined. For those interested in influence, there are also metadata fields that indicate when an author is quoting or citing another text. By placing <q> tags around quotations and <bibl> tags around citations of authors or works, the Text Creation Partnership made it easy for researchers to begin looking for citational patterns in early modern literature:
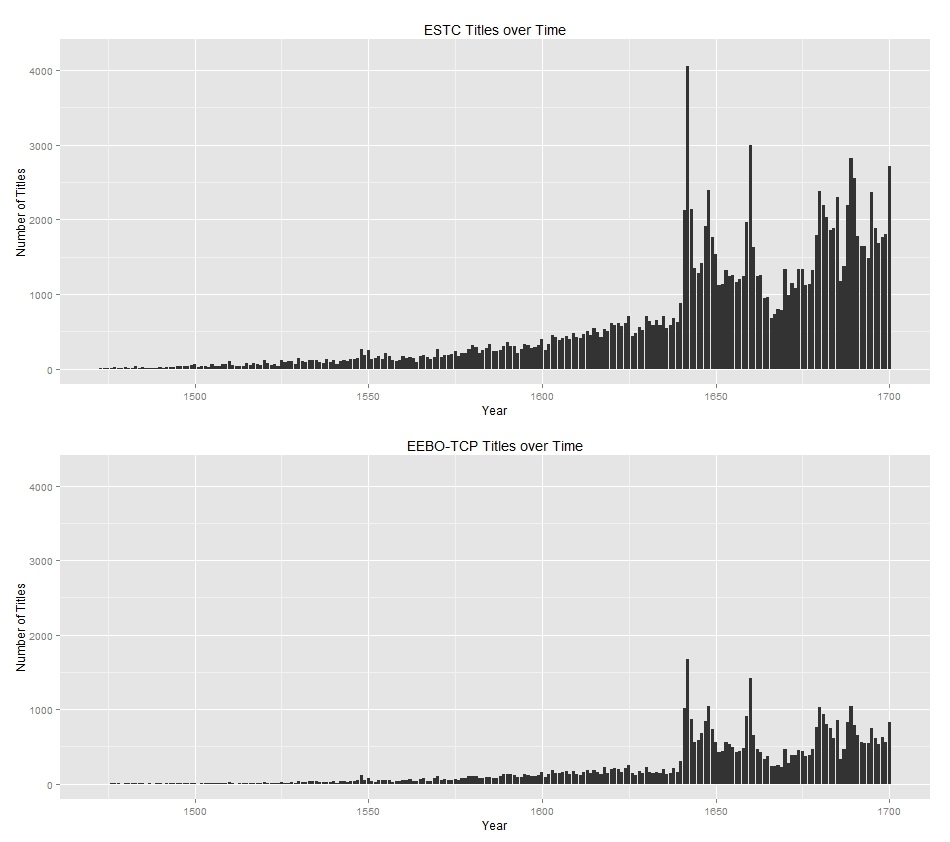
Using a simple script, one can easily extract all of the quotations and bibliographic citations from all files in the EEBO-TCP corpus. Because the EEBO-TCP corpus contains roughly one third of the titles from the period recorded in the definitive English Short Title Catalogue, this citational data can serve as a fairly representative archive of intertextual trends in early modern England:
That is, at least, the idea in theory. In practice, the data is quite messy, and in its native form, is all but algorithmically unapproachable. Take, for example, the following references contained within <bibl> brackets:
IUDGES V. XXIII.
Iudges, 5 23.
IVDGES 4. 21.
Iudg. 42.
[Judg. 21.]
Human investigators who look into the matter can easily discover that each of these references refers to the Book of Judges. To allow computers to recognize this fact, however, I had to spend several weeks sifting my way through the collection of
W. ??.
Qu.
ラ Testimony of a great Divine.
Setting these obscure references aside, I cleaned up the sources about which I was reasonably confident, such as the references to Judges above. After I had aggregated all of these, I was naturally curious to see which texts and authors were most cited in the corpus. Here are the top forty:
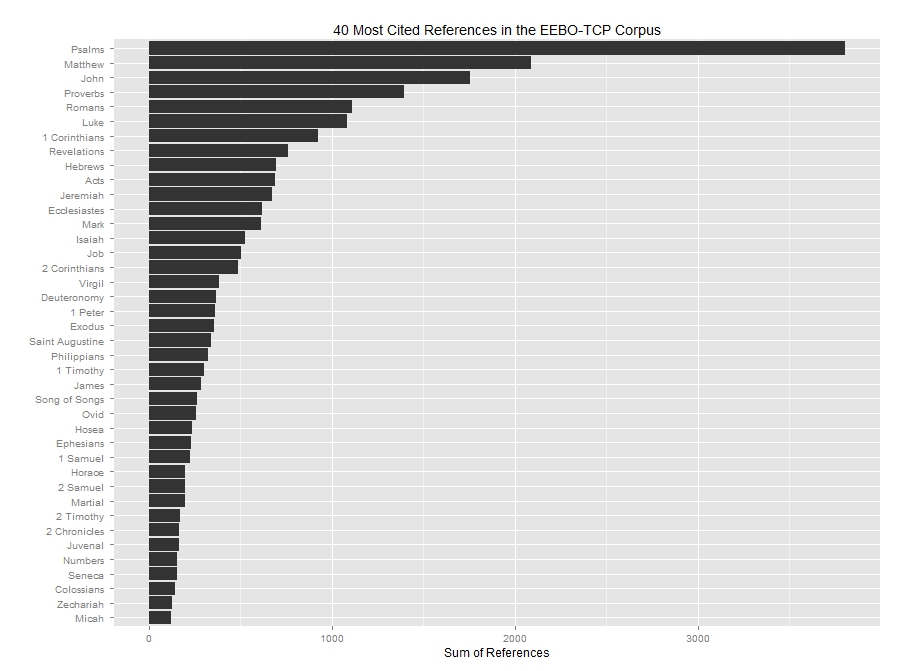
Biblical citations predominate, with the greatest number of references going to the Book of Psalms. (It should be noted that in most translations of the Bible into English and Latin, the Book of Psalms has by far the greatest number of verses and words.) Matthew leads the Evangelists, followed by John, then Luke, then Mark. The highest frequency Greco-Roman writers include Virgil, Ovid, Horace, Martial, Juvenal, and Seneca, in that order. While this data might not revolutionize early modern scholarship, it might be helpful in the classroom. When teaching undergraduates about the works early modern audiences read, heard, and cited, for example, such visualizations can help to bring home the profound religiosity of the age.
Drawing on the same data that underlies this visualization, one can also analyze networks of influence in early modern literature. Rather than conceive of influence as a series of vectors, each measuring the number of times a given work or author is cited in the TCP corpus, one can analyze the kinds of works and authors that are cited together. Such forms of analysis are often referred to as “co-citation networks,” or networks of references that tend to be cited together. For example, say our corpus contained references to only nine different sources:
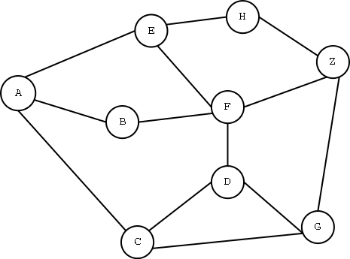
In that case, we could visualize each of these sources as a “node” in a network graph and could create an “edge,” or connecting line, between any two nodes that were cited within a text in the corpus. The sample graph above would then illustrate the fact that references “A” and ‘B’ are cited within one text, ‘G’ and ‘Z’ in another, and so on. Using this method on the EEBO-TCP corpus, I thought, might help to reveal latent structures embedded within early modern citation networks. With the curated EEBO-TCP citation data in hand, I therefore proceeded in the fashion described above, transforming each cited author or work into a node, and creating edges between any two nodes cited within a single work. Here is one visualization of the results:
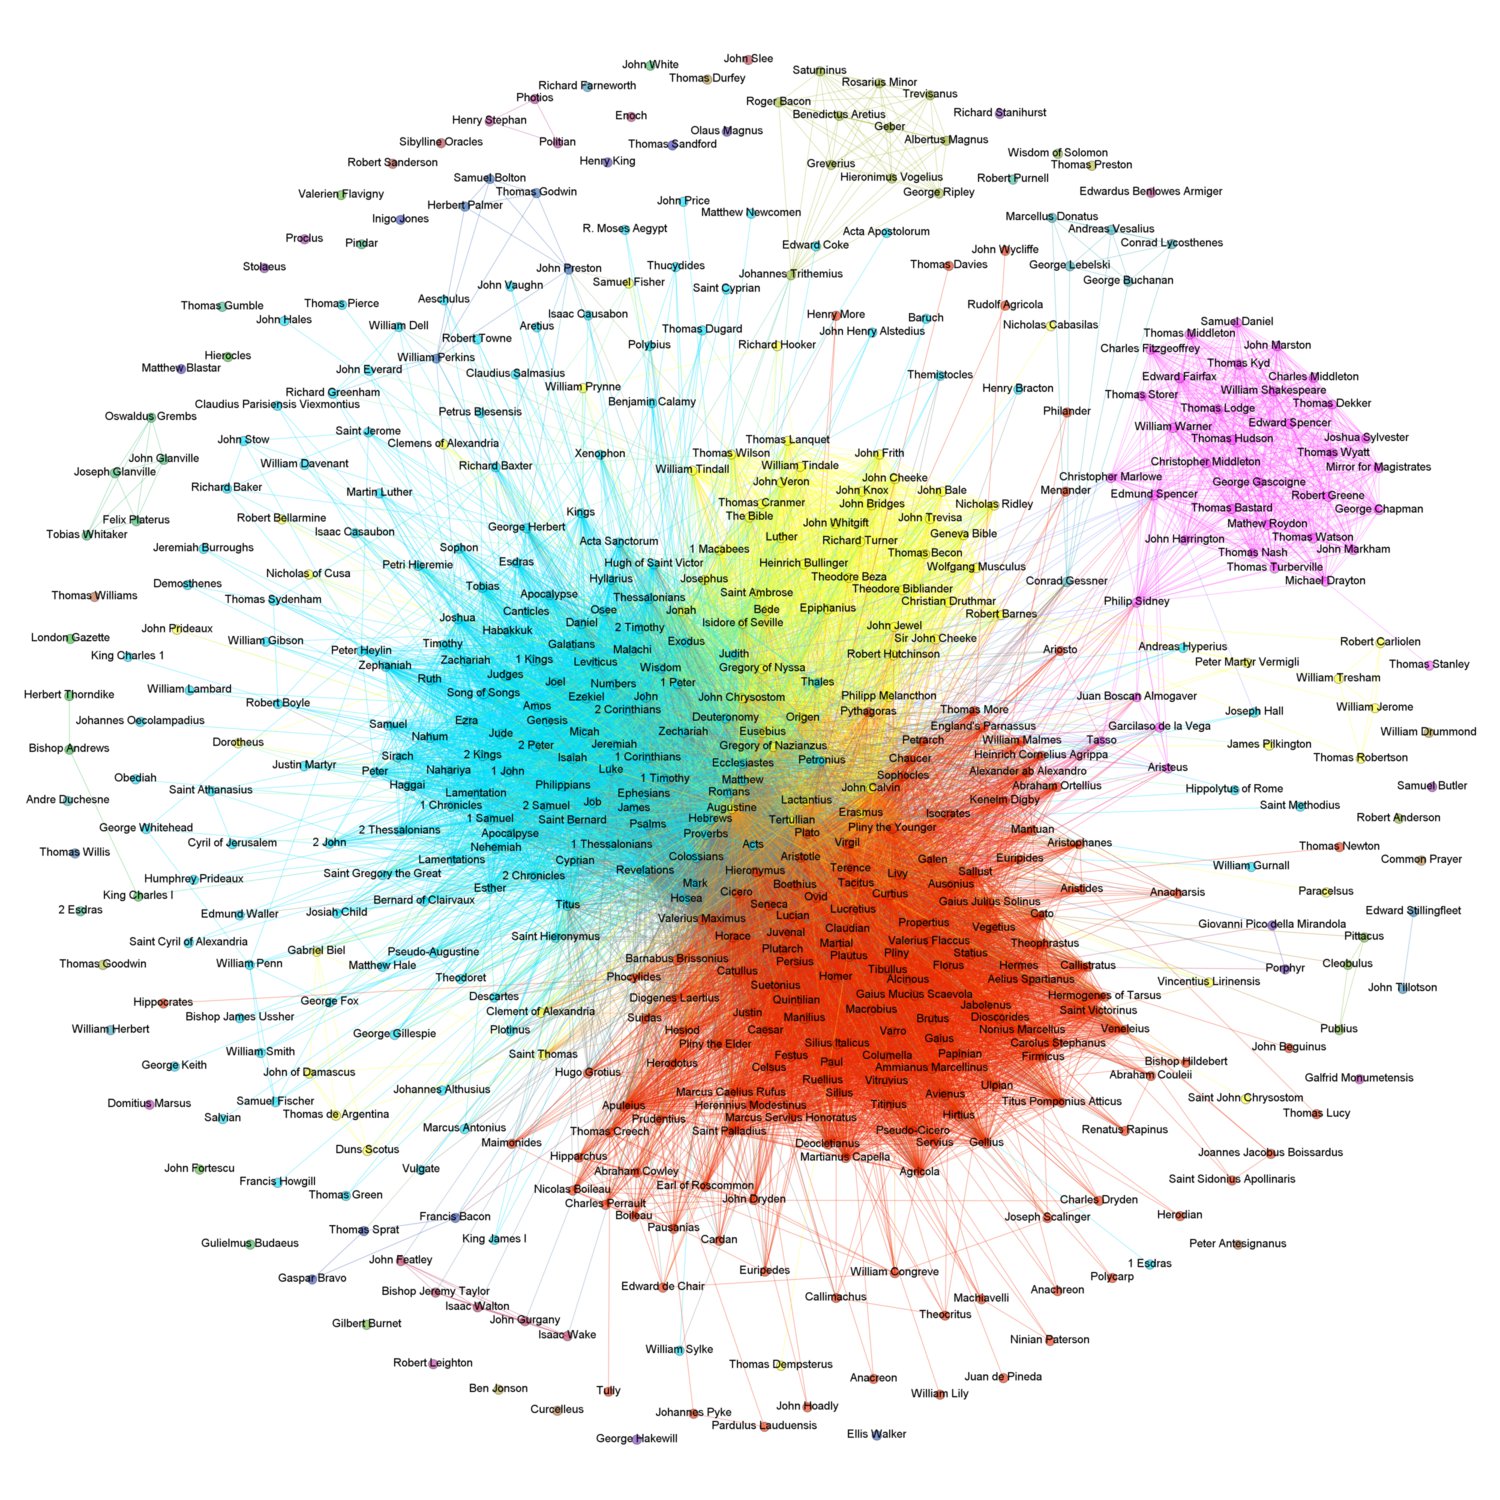
In this graph, each node has been assigned a color. These colors are determined by an algorithm that identifies clusters of nodes that are commonly cited together, and then colors the different clusters accordingly. Analyzing the nodes that cluster together, one finds four particularly well-defined groups of references: the light blue cluster of nodes, which are biblical books (Leviticus, Corinthians); the red cluster of nodes, which are classical references (Macrobius, Lucretius); the yellow cluster of nodes, which are Reformation-era martyrs and theologians (Theodore Beza, Richard Turner); and the purple cluster of nodes, which are literary writers (Philip Sidney, William Shakespeare). The results of the procedure are intuitively legible: each group represents a fairly homogenous collection of authors and works, and the divisions that split the groups apart represent fairly significant generic differences between the various references contained in the data. If this is right, then such a map could perhaps serve as a useful resource in the classroom. When discussing the so-called ‘battle of ancients and moderns,’ for instance, graphs like the present one might help students visualize the different ways early modern citation practices established divisions between these groups.
Using a slightly different visualization, one can identify the points of connection between and among these ostensibly divided groups. This link will take you to an interactive site that contains all of the data included in the previous plot, including the modularity rankings that separated and color-coded the nodes. Unlike the previous plot, however, the visualization at the other end of that link allows users to click on a particular node and see all of the others to which that node is connected. Comparing the networks of each of these nodes, one can produce at a glance one measure of the degree to which the given node was cited with works and authors from the classical inheritance, for instance. The results sometimes lead to new questions. For example, the interactive plot demonstrates that when early modern authors cited Paul the Apostle in the context of classical writers like Apuleius, they cited Paul’s given name; when they cited Paul in biblical contexts, by contrast, they cited his works, such as ‘Romans.’ Why might that be the case? Other points of interest I’ve come across in this visualization include the relatively isolation of the alchemists (George Ripley, Geber, etc.), towards the bottom of the plot, and the predominance of biblical citations in works that reference Descartes. Both of these observations strike me as less intuitive than the separation of authors into disparate modularity rankings, for instance, and both seem worthy of further inquiry.