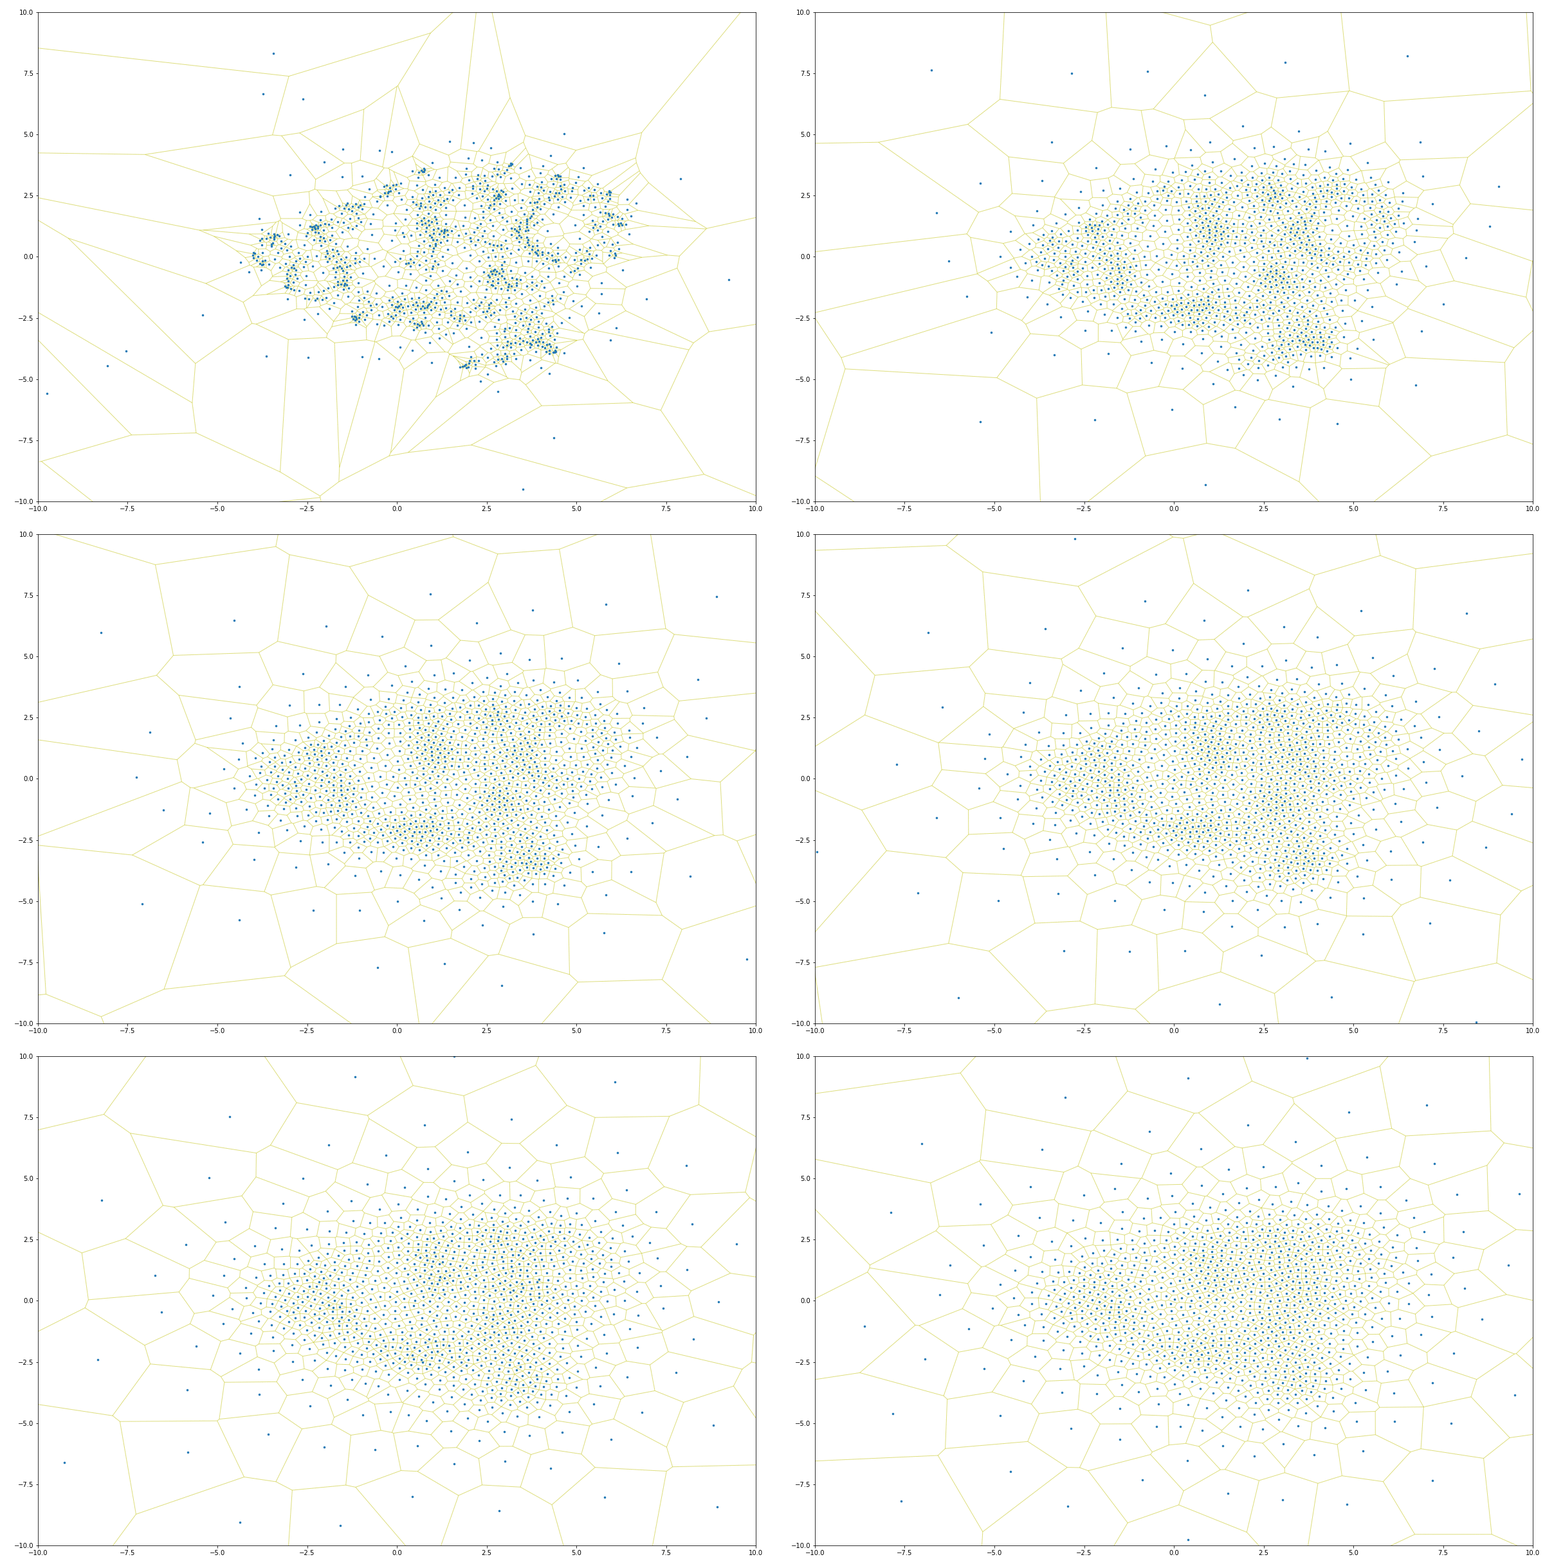
Lloyd iteration is an iterative algorithm that distributes points within a space. During each iteration of the algorithm, Lloyd iteration builds a Voronoi map in which each point is contained within a distinct Voronoi cell, then centers each point within its cell. This operation causes overlapping points to spread out within a distribution, which can be helpful for data visualization purposes:

Lloyd iteration does not constrain the expansion of points, which means that as the number of iterations increases, points near the convex hull (the outside border) tend toward infinity. This can be a problem for many use cases, as Lloyd iterations can expand the domain of a set of points quite significantly.
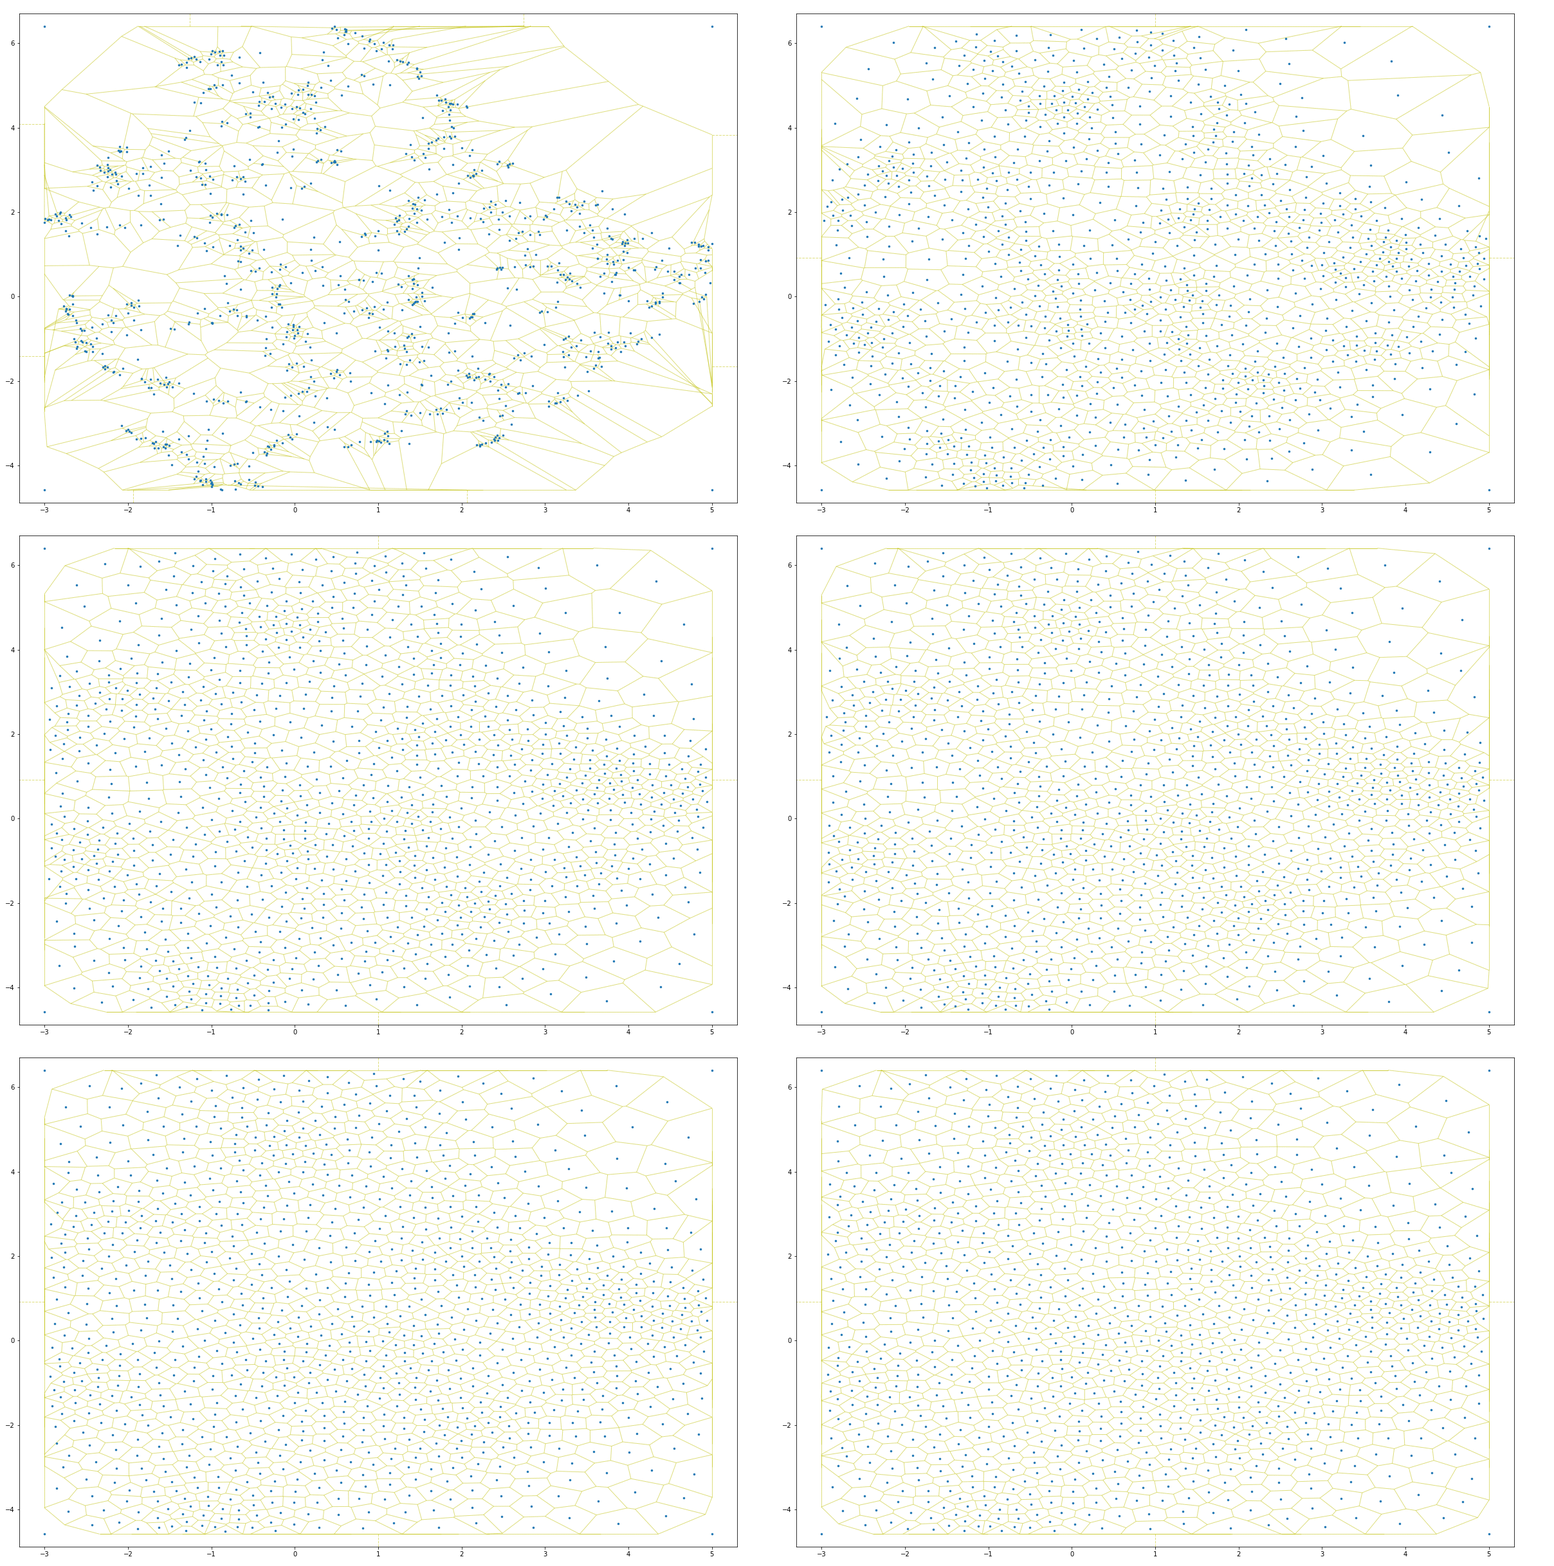
It turns out one can solve this problem by adding vertices at the bounding box of the initial point distribution. These vertices will prevent the Voronoi map from extending beyond the initial point domains, which ensures the resulting point posititions remain inside the initial point domains:

As one can see, in just a few iterations, the constrained Lloyd model distributes points so as to prevent overlapping points. This lets one strategically “jitter” points so as to make it easy to interact with each (click to toggle):
To make it easier to transform points in this way, I put together a small package named lloyd. One can install the package with pip:
pip install lloydAfter installing the package, one can transform the positions of points within a two-dimensional numpy array in the following way:
from lloyd import Field
import numpy as np

# generate 2000 observations with 2 dimensions
points = np.random.rand(2000, 2)

# create a lloyd model on which one can perform iterations
field = Field(points)

# run one iteration of Lloyd relaxation on the field of points
field.relax()

# get the resulting point positions
new_positions = field.get_points()
new_positions will then be a numpy array with the same shape as points, only the positions of each point will be updated by the Lloyd algorithm described above. To further distribute points, one can call the .relax() method on the lloyd model until the distribution is optimal for plotting.